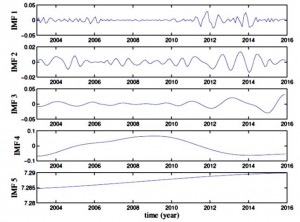
The IMFs of the color index [FUV-MUV] are shown from the first (highest frequency) to the last (lowest frequency) starting from the top. The data sets cover the time between May 2003 and October 2015. IMF4 corresponds to 11-years Schwabe cycle.The radiative and particle output of the Sun is variable on different time scales, from seconds to the evolutionary scale of the star. These fluctuations, due to instabilities and non-stationary processes related to solar magnetic field dynamics and evolutionary mechanisms, affect the energy balance of the Earth’s surface and atmosphere, thus influencing our climate.
Solar UV variability is extremely relevant for the stratospheric ozone. It has an impact on Earth’s atmospheric structure and dynamics through radiative heating and ozone photochemistry. In order to investigate the solar spectral variability, we use SOLSTICE (the Solar Stellar Irradiance Comparison Experiment) data. Data sets used are far UV (115-180nm) and middle UV (180-310nm), as well as the Mg II index (the Bremen composite). We introduce the [FUV-MUV] color to study the solar spectral characteristics, as well as analysis of the color versus Mg II index. To isolate the 11-year scale variation, we used the Empirical Mode decomposition (EMD) on the data sets.
The [FUV-MUV] color strongly correlates with the Mg II index. More in detail, the [FUV-MUV] color shows a time dependent behavior when plotted versus Mg II index. More in detail, the analysis shows that the star changes the UV spectral distribution during 11-y cycle with a different behavior during the descending phase of cycle 23 and growing phase of cycle 24. The observed UV evolution can provide empirically-motivated UV reconstructions over the cycles where suitable Mg II data exist.
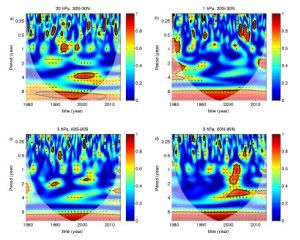
The color index dependence on the Mg II index and time. Time is represented by the colorbar (shown on the right). Data points for the November 2012, August, September, October and November 2013 and January 2014 are not shown, as these months are not available for the SSI data. Note that the strong correlation [FUV-MUV] color versus Mg II index shows two different behaviors during the descending phase of cycle 23 and the increasing phase of cycle 24. The two slopes merge during the solar minimum.The long-term variability of stratospheric ozone mass mixing ratio (O3) and temperature (T) from 1979 to 2013 have been investigated using the ERA-Interim reanalysis product delivered by the European Centre for Medium Range Weather Forecasts (ECMWF). The response of the stratosphere to the 11-y solar activity cycle was investigated using the Mg II Index time series for the common time section, i.e., for the period 1979-2013. Results reveal the following features: (i) upward (downward) trends characterize zonally averaged O3 anomalies in the upper (middle-lower) stratosphere, while prevailing downward trends affect the T field; (ii) Correlations between O3 and Mg II, T and Mg II, and O3 and T are consistent with photo-chemical reactions occurring in the stratosphere and large-scale transports; (iii) The Wavelet cross-spectra between O3 and Mg II Index show common power at 11-year period particularly in tropical regions around 30–50 hPa and different relative phase in the upper and lower stratosphere.
Wavelet coherence for the input signals O3 and Mg II Index for selected vertical pressure levels and latitude bands: (a) 30 hPa, 30S–30N; (b) 1 hPa, 30S–30N; (c) 3 hPa, 60S–90S; (d) 3 hPa, 60N–90N. Thick contours identify the 5 % significance level against red noise, while arrows denote the phase between the two signals (in phase pointing eastward and out of phase pointing westward).
![The colour index dependence on the Mg II index and time. Time is represented by the colourbar (shown on the right). Data points for the November 2012, August, September, October and November 2013 and January 2014 are not shown, as these months are not available for the SSI data. Note that the strong correlation [FUV-MUV] colour versus Mg II index shows two different behaviours during the descending phase of cycle 23 and the increasing phase of cycle 24. The two slopes merge during the solar minimum.](https://helio.roma2.infn.it/wp-content/uploads/2016/02/UVCOLvsMgII-300x234.jpg)